

Running business reports
Last updated:
This feature requires a subscription to the SortScape Premium plan.
SortScape includes predefined reports to help you understand how your business is performing. Using this data you can answer questions like:
- Which customers do I spend the most time on?
- Which of my employees work the most hours?
- What is my future estimated revenue?
- Which completed jobs still need invoicing? (open Invoicing → Jobs pending invoicing — see Invoicing customers)
Accessing business reports
Section titled “Accessing business reports”Only administrators have access to the reports screen.
Open Reports from the top navigation, or go straight to Reports.
Reports is not in the SortScape mobile app menu. On a phone, open app.sortscape.com/reports in your phone’s web browser (Safari or Chrome) and log in. Reports are easier to read on a computer.
Reports are grouped into tabs (Home, Employee hours, Customers, Financial, Future-looking, Materials, Timesheets, and Quotes). Some reports appear on more than one tab.
Open in Reports links below open the matching tab. Click the magnifying glass next to the report title to open it. Reports run inside SortScape and cannot be opened directly in a new browser tab from a help article link.
Modifying and exporting reports
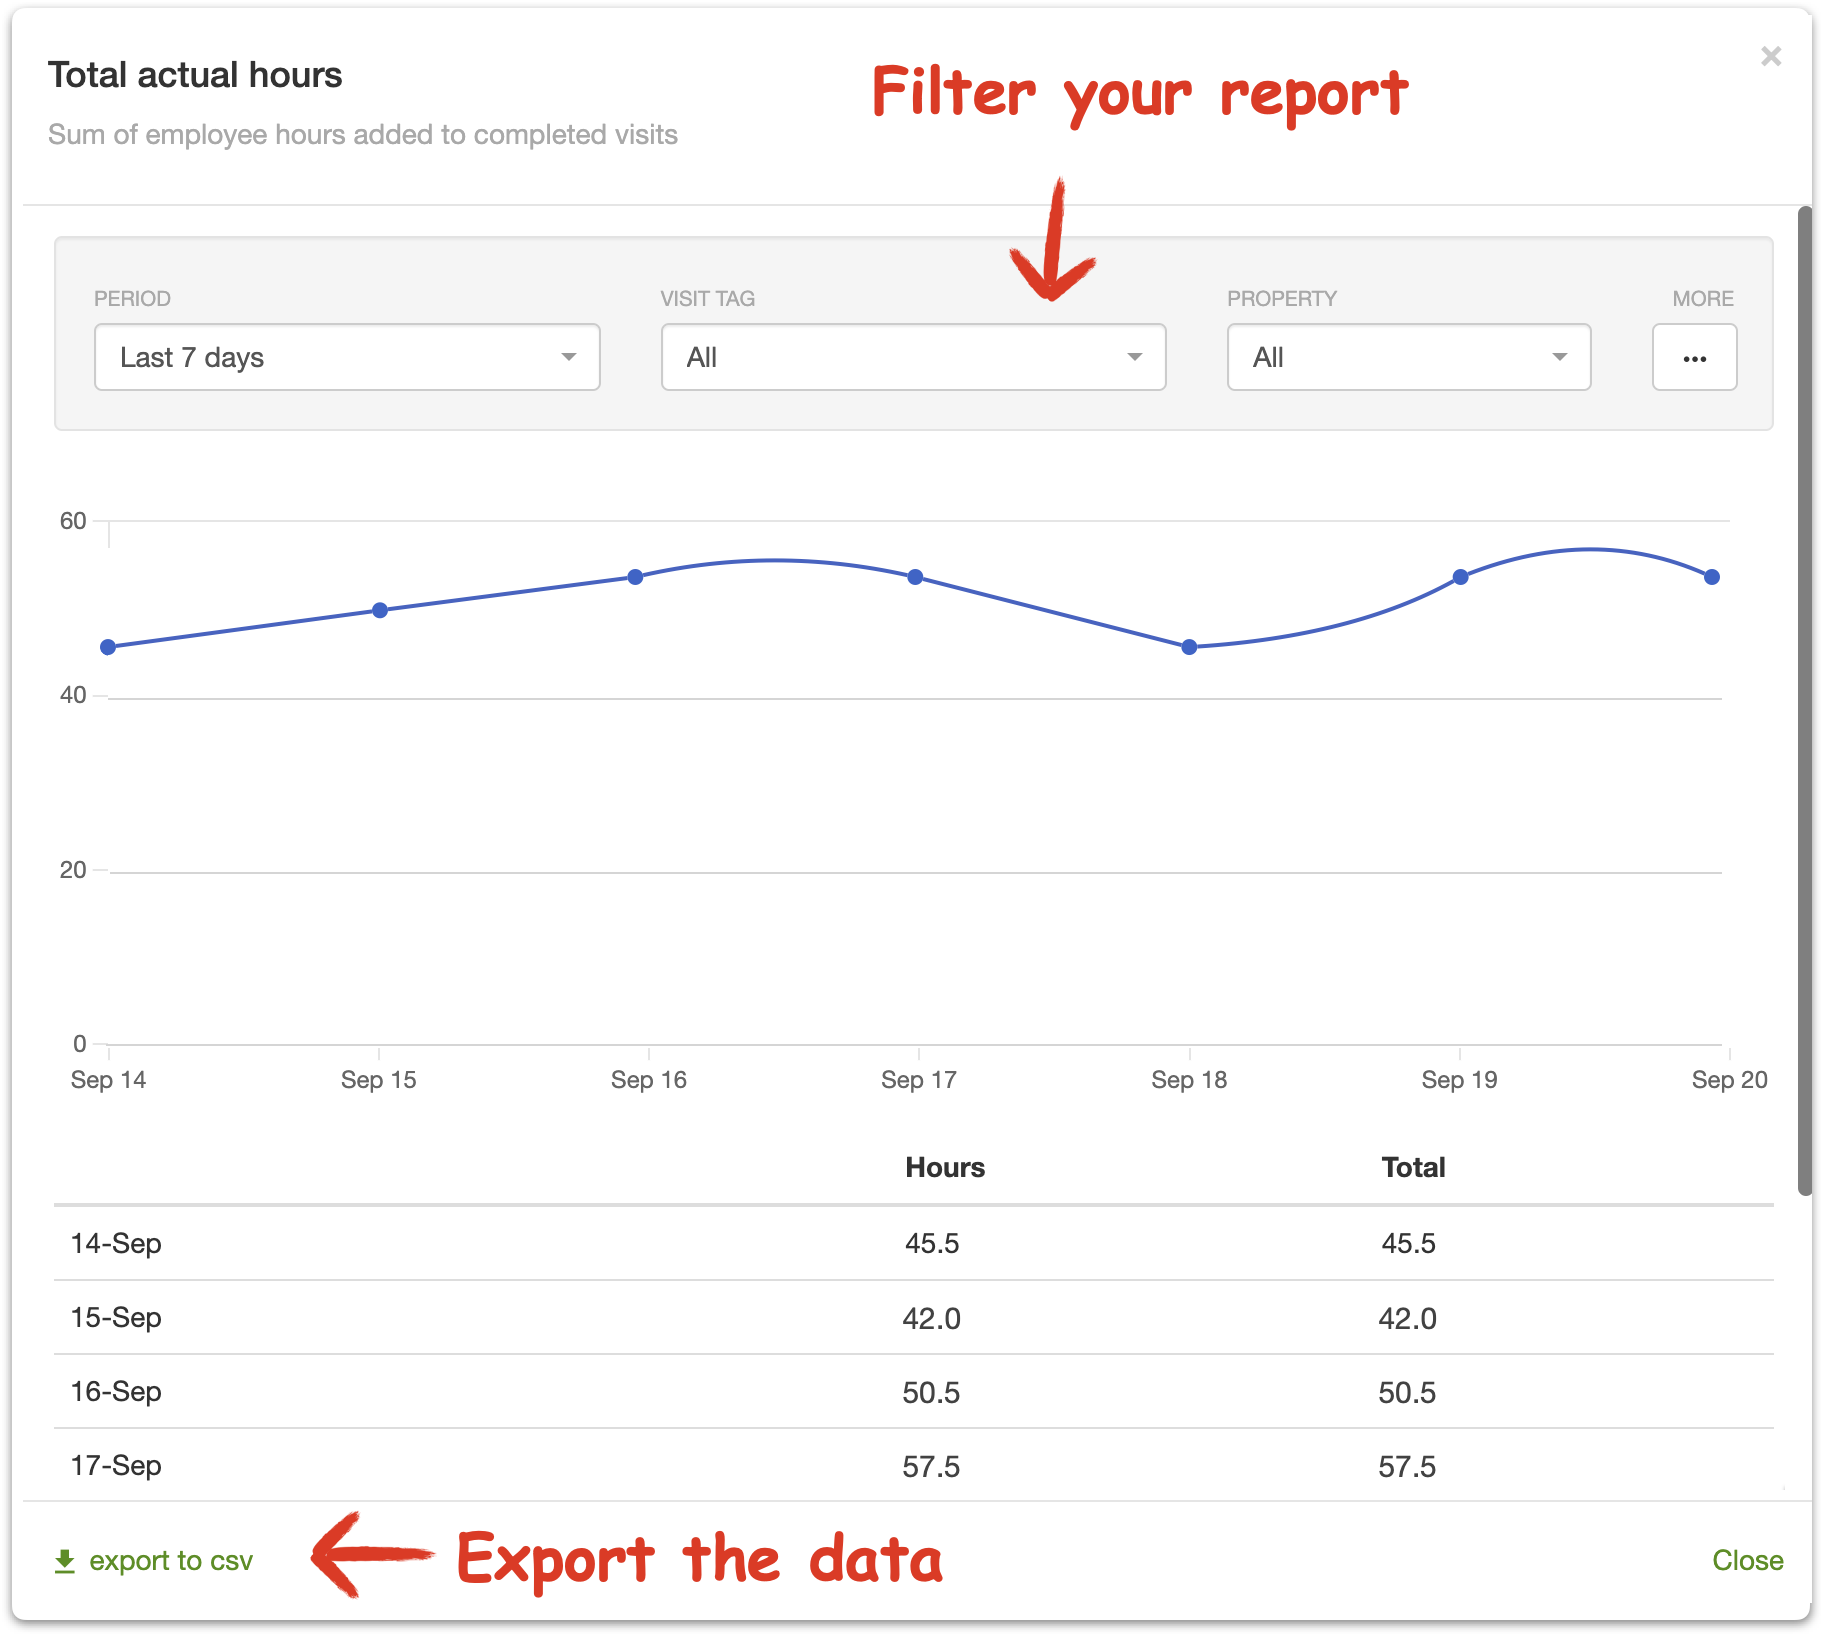
Section titled “Modifying and exporting reports”When viewing a report, you can set the chart type (column, bar, line, area, or pie) and filter on attributes relevant to that report.
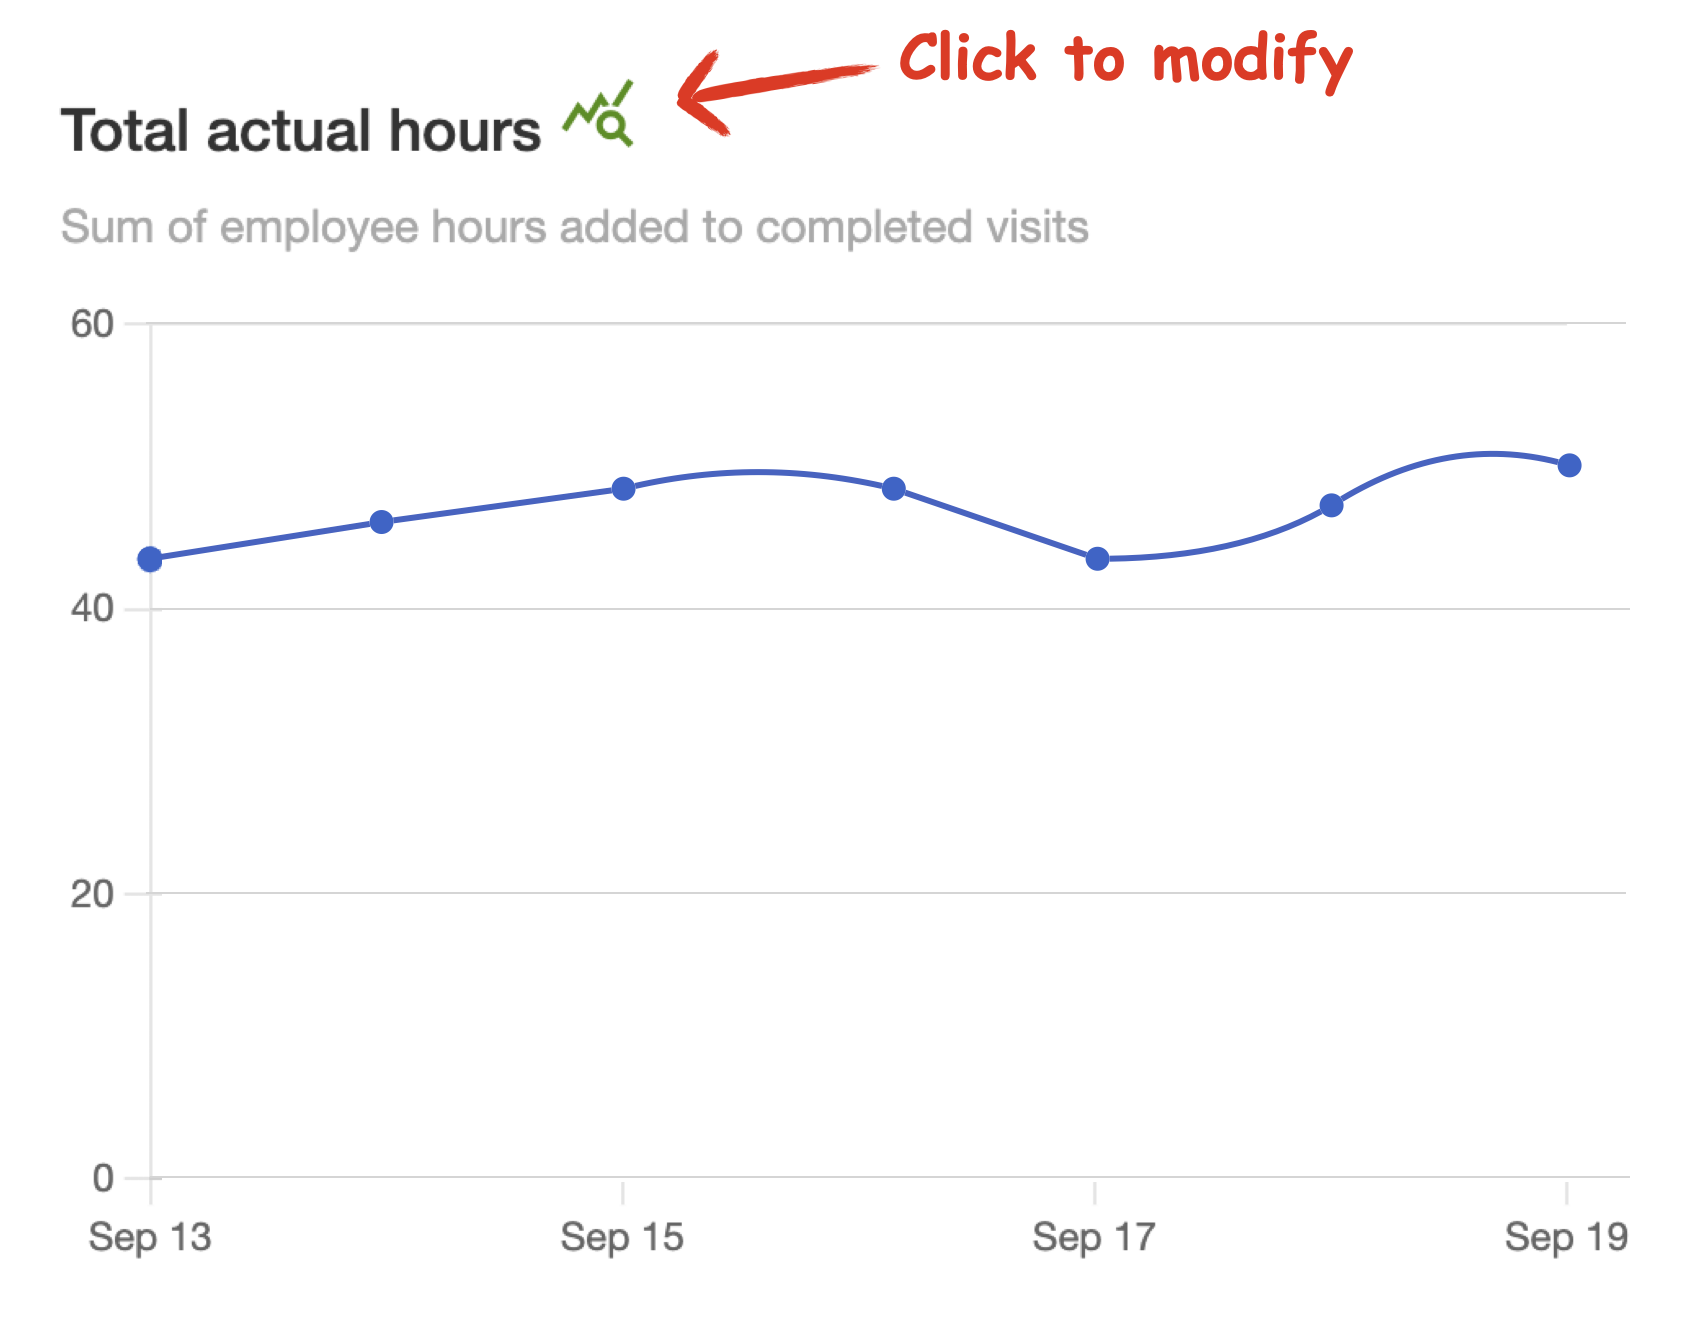
To change filters, click the magnifying glass icon next to the report title.
You can then apply filters and export chart data to CSV:
Report previews and date ranges
Section titled “Report previews and date ranges”The charts on each Reports tab are quick previews. Every report starts with a default date range (for example, last 7 days for most past reports, next 7 days for future-looking reports, and last 3 months for quote reports). Those defaults keep the overview fast to load.
The preview is not the limit. Open any report (click the magnifying glass or report title), then change Date range and Group by to suit what you need. Options include Last 3 months, Last 12 months, Year to date, or a custom start and end date (up to 400 days).
For monthly trends, set Group by to Month so each column or point is one calendar month.
Not on Premium?
Section titled “Not on Premium?”Business Reports (the whole Reports screen) require a SortScape Premium plan. If you are on Basic, the Reports menu is not available.
You can still pull hours data over longer periods without Premium:
- Export completed jobs: Open Invoicing → ⋮ → Export completed jobs and set Completed between to your date range. Logged hours are in the Note column, so you can total them in a spreadsheet. See FAQ - How do I export job information for a specific customer? for the columns.
- Export scheduled jobs by month: On Schedule, switch to Month view, then Tools → Export → Scheduled. Repeat for each month you need. The Time spent column includes hours when day sheets are enabled. See How do I export all the jobs on my schedule?.
- Export timesheets: If your business uses timesheets, open the Timesheets screen, go to the All tab, and use Export in the upper right for a CSV of submitted hours.
These exports take more spreadsheet work than Premium reports, but they cover the same underlying job and timesheet data. On Premium, Detail of hours on jobs is the raw job-hours export (one row per time block). The Timesheets Export is still the payroll hours export.
How to read each report description
Section titled “How to read each report description”Each report below includes:
- What it measures — the headline number or chart
- Data source — which records SortScape reads (completed jobs, scheduled jobs, timesheets, invoices, quotes, and so on)
- How it’s calculated — only included when the math is not obvious from the name
- Default view — starting date range, chart type, and time grouping
- Filters — what you can narrow down in the report settings
- When to use it — the business question it answers, and how it differs from similar reports
- Requirements or caveats — feature flags, integrations, or assumptions baked into the numbers
Estimated value on job-based reports is the job’s calculated price in SortScape (labor plus items/materials, depending on how the job is set up). It is an estimate in SortScape, not necessarily what was invoiced.
Completed jobs means jobs marked completed in the date range. Scheduled jobs means future jobs that are not skipped.
Past reports default to the last 7 days. Future reports default to the next 7 days. Quote reports default to the last 3 months, grouped by month.
Home tab
Section titled “Home tab”Quick overview charts for activity, revenue outlook, and quote conversion.
Number of jobs completed
Section titled “Number of jobs completed”What it measures: How many jobs you completed over time.
Data source: Completed jobs, grouped by completion date.
Default view: Last 7 days, line chart, grouped by day.
Filters: Date range, group by (day/week/month/year), property, job tag. Advanced: chart type.
When to use it: Track overall workload and seasonal busyness. Pair with Total actual hours to see whether job counts are rising while hours stay flat (shorter jobs) or the other way around.
Total actual hours
Section titled “Total actual hours”What it measures: Total hours logged on completed jobs across the whole business.
Data source: Actual hours on completed jobs (from day sheets / logged job hours).
Default view: Last 7 days, line chart, grouped by day.
Filters: Date range, group by, property, job tag. Advanced: chart type.
When to use it: Company-wide productivity trend. Compare with Future estimated hours to see whether past output aligns with what is still scheduled ahead.
Requirements: Day sheets (job hour logging) must be enabled.
This report sums actual hours on completed jobs only. It is not the same as the hours total on a job run on the schedule, which still uses estimated time for jobs that are not completed yet. See How schedule hour totals work.
Estimated value of future jobs
Section titled “Estimated value of future jobs”What it measures: Combined estimated value of upcoming scheduled work.
Data source: Scheduled (not yet completed) jobs, using each job’s estimated value.
Default view: Next 7 days, line chart, grouped by day.
Filters: Future date range, group by, property, job tag. Advanced: chart type.
When to use it: Revenue you have already booked on the schedule. This is pipeline value, not cash received. Compare with Estimated value of completed jobs for past vs upcoming work.
Value of invoices created
Section titled “Value of invoices created”What it measures: Total dollar value of invoices created over time.
Data source: Invoices in SortScape, grouped by invoice date (the date the invoice was created in SortScape).
Default view: Last 7 days, line chart, grouped by day.
Filters: Date range, group by, contact. Advanced: chart type.
When to use it: Billing activity and cash you have raised invoices for. Differs from Estimated value of completed jobs, which uses job estimates rather than invoice totals.
Caveats: If you invoice in Xero or QuickBooks Online, changes made in those systems after the invoice was created are not reflected here. Use your accounting system’s profit and loss report for authoritative revenue figures.
Requirements: Invoicing in SortScape or an connected accounting integration.
Quote conversion rate (count) and (value)
Section titled “Quote conversion rate (count) and (value)”These two reports also appear on the Quotes tab. See Quote reports below for full detail on how conversion is calculated.
Open in Reports (count) · Open in Reports (value)
Employee hours tab
Section titled “Employee hours tab”Hours logged on completed jobs, plus capacity planning for scheduled work. All reports on this tab require day sheets (crew hour logging on jobs).
Total hours by employee
Section titled “Total hours by employee”What it measures: Hours each employee logged on completed jobs.
Data source: Job hours on completed jobs, one series per employee.
Default view: Last 7 days, stacked column chart, grouped by day.
Filters: Date range, group by, employees. Advanced: property, job tag, job type (time and materials / fixed price / non-billable), chart type, stacked on/off.
When to use it: Who is carrying the most workload, and how hours are distributed across the team. Compare with Total timesheet hours by employee if you use timesheets as well: job hours reflect time on jobs; timesheets reflect clocked shift time. For every time block as raw rows (Hours ID and Job ID), use Detail of hours on jobs.
Number of jobs by employee
Section titled “Number of jobs by employee”What it measures: How many completed jobs each employee logged hours against.
Data source: Completed jobs where the employee has at least one job hour entry.
Default view: Last 7 days, stacked column chart, grouped by day.
Filters: Same as Total hours by employee.
When to use it: Activity and coverage (how many jobs each person touched), not total time. An employee with few jobs but high hours may be on larger jobs.
Total hours by job type
Section titled “Total hours by job type”What it measures: Hours on completed jobs split by invoicing type.
Data source: Completed jobs, grouped into Time and materials, Fixed price, and Non-billable.
Default view: Last 7 days, stacked column chart, grouped by day.
Filters: Date range, group by, job type. Advanced: chart type, stacked on/off.
When to use it: See how much labor goes into billable vs non-billable work, or how fixed-price jobs compare to time-and-materials jobs.
Requirements: Invoicing basis / job type tracking must be enabled for your account.
Estimated vs actual hours
Section titled “Estimated vs actual hours”What it measures: Estimated hours on completed jobs compared with actual hours logged.
Data source: Completed jobs. Est sums job estimates; Actual sums logged job hours.
How it’s calculated: Two series over the same period: total estimated time vs total actual time. Large gaps highlight scheduling or quoting issues.
Default view: Last 7 days, column chart, grouped by day.
Filters: Date range, group by, property. Advanced: job tag, chart type, stacked on/off.
When to use it: Improve future estimates and spot jobs that consistently run long. For per-customer variance, use Hours over budget by property.
Total hours per property
Section titled “Total hours per property”What it measures: Hours logged per property (customer site) on completed jobs.
Data source: Job hours on completed jobs, one bar per property.
Default view: Last 7 days, horizontal bar chart (totals for the whole range).
Filters: Date range, property, job tag. Advanced: how property names appear (property name, contact name, or both), chart type, stacked on/off.
When to use it: Which customers consume the most labor. Pair with Estimated revenue per hour per property to see whether high-hour customers are also high value per hour.
Also on: Customers tab.
Hours over budget by property
Section titled “Hours over budget by property”What it measures: How far over or under estimate each property’s completed work ran, in hours.
Data source: Completed jobs with both an estimate and logged actual hours.
How it’s calculated: For each property, actual hours minus budget hours. Budget hours account for crew size on the job (multi-person jobs scale the estimate). Positive numbers mean the job took longer than estimated.
Default view: Last 7 days, horizontal bar chart ranked by variance.
Filters: Date range, property, job tag. Advanced: property name display.
When to use it: Find customers or job types where you consistently underestimate. More precise than Estimated vs actual hours when you care about specific properties rather than the whole business.
Also on: Customers tab.
Total hours per property and employee
Section titled “Total hours per property and employee”What it measures: Hours each employee spent at each property.
Data source: Job hours on completed jobs, grouped by property with employee breakdown.
Default view: Last 7 days, stacked column chart per property.
Filters: Date range, property, job tag. Advanced: property name display, chart type, stacked on/off.
When to use it: Who does the work at your largest accounts, useful for handovers, training, and account reviews.
Also on: Customers tab.
Future estimated hours
Section titled “Future estimated hours”What it measures: Estimated labor hours still on the schedule.
Data source: Scheduled jobs (not completed, not skipped), using each job’s estimated time.
Default view: Next 7 days, line chart, grouped by day.
Filters: Future date range, group by, job tag. Advanced: chart type.
When to use it: Upcoming labor demand. Compare with Total hours scheduled vs hours available to see whether the schedule fits crew capacity.
Also on: Future-looking tab, Home tab.
Total hours scheduled vs hours available
Section titled “Total hours scheduled vs hours available”What it measures: Scheduled estimated hours plotted against available crew capacity.
Data source: Scheduled job estimates vs a calculated capacity line.
How it’s calculated: Est hours sums estimated time on scheduled jobs. Available hours assumes 6.5 hours per schedulable active employee per working day, minus employees marked unavailable, and respects your tenant work-week setting (Monday–Friday vs including Saturday/Sunday).
Default view: Next 7 days, column chart, grouped by day.
Filters: Future date range, group by. Advanced: chart type.
When to use it: Avoid over-scheduling or leaving crews underutilized. Treat this as a planning guide: real job times and availability will differ.
Also on: Future-looking tab.
Total actual hours vs hours available
Section titled “Total actual hours vs hours available”What it measures: Actual hours logged on completed jobs plotted against available crew capacity. Use this to review how utilized your team was in the past.
Data source: Job hours on completed jobs vs a calculated capacity line.
How it’s calculated: Actual hours sums hours logged on completed jobs. Available hours uses the same capacity calculation as Total hours scheduled vs hours available: 6.5 hours per schedulable active employee per working day, minus employees marked unavailable, respecting your tenant work-week setting.
Default view: Last 7 days, column chart, grouped by day.
Filters: Date range, group by, employees. Advanced: chart type.
When to use it: Review labour utilization after the fact. If actual hours are close to or above available hours, your team was highly utilized. If they are well below, there was spare capacity. Divide actual hours by available hours for the same period to estimate utilization as a percentage (the report does not show a % column).
Also on: Backward-looking tab.
Detail of hours on jobs
Section titled “Detail of hours on jobs”What it measures: Every time block logged on completed jobs, one row per entry.
Data source: Job hours added to completed jobs (from Add hours or the job timer). This is not timesheet hours.
How it’s calculated: Table report (no chart). One row for each hours entry on a completed job in the date range. Incomplete jobs are left out, matching the other hours reports.
Columns: Hours ID, Job ID, date, employee, property, start time, end time, break minutes, hours, note, created at, and updated at.
Hours is the time on that block after any break. Hours ID stays the same if you export again later, so you can match rows in Excel when someone adds or edits a block. Job ID identifies the job. Updated at changes if that block is edited.
Default view: Last 7 days, table.
Filters: Date range, employees, property. Advanced: job tag.
When to use it: You want a complete export of the raw hours added to jobs, so you can do your own reporting in a spreadsheet. Use this when the chart reports are too summarised, or when the schedule export’s Time spent column (all blocks in one cell) is too hard to work with.
This is job time only. It does not include travel, lunch, or other clocked shift time that lives on timesheets. For payroll hours, use Total timesheet hours by employee or the Timesheets CSV export. See Job hours vs timesheet hours.
Requirements: Day sheets (job hour logging) must be enabled.
Customers tab
Section titled “Customers tab”Property-level engagement, profitability signals, and customer growth exports.
Number of jobs completed per property
Section titled “Number of jobs completed per property”What it measures: Job count per property over the selected period.
Data source: Completed jobs, one series per property.
Default view: Last 7 days, horizontal bar chart.
Filters: Date range, property, job tag. Advanced: property name display, chart type, stacked on/off.
When to use it: Service frequency and customer engagement. A dropping job count may mean a client paused service or you missed scheduling.
Estimated revenue per hour per property
Section titled “Estimated revenue per hour per property”What it measures: Estimated dollars earned per hour of labor for each property.
Data source: Completed jobs in the date range.
How it’s calculated: Total estimated job value ÷ total actual hours logged, per property. Properties are ranked highest to lowest.
Default view: Last 7 days, horizontal bar chart.
Filters: Date range, property, repeating type (all / repeating only / one-off only). Advanced: job tag, property name display.
When to use it: Spot your most and least profitable customers per labor hour. Useful when repricing or deciding which accounts to prioritise.
Also on: Financial tab.
Cut value
Section titled “Cut value”What it measures: The combined estimated value of one full round of recurring work, per property.
Data source: Active recurring jobs. For each recurring series, SortScape takes the next upcoming job price once, then groups by property.
How it’s calculated: Industry “cut value” benchmark: what one pass around your recurring book of work is worth. Filter by job tag to isolate a service (for example lawn mowing) or a geographic round.
Default view: Bar chart of properties (no date range; snapshot of current recurring work).
Filters: Property, job tag. Advanced: property name display.
When to use it: Size your recurring round and compare properties’ contribution to a single week’s run. Excludes one-off and non-billable recurring jobs.
Also on: Financial tab.
Properties added per period
Section titled “Properties added per period”What it measures: How many new properties you have added over time.
Data source: Properties that have at least one job (scheduled or completed) on the account. Properties created but never given a job are excluded from both CSV exports on this tab.
How it’s calculated: Summary CSV with monthly and yearly counts based on property creation date.
Default view: CSV download (not a chart). Monthly section lists month, year, and count; yearly section lists year and count.
When to use it: Growth trends and seasonal patterns in customer acquisition. Pair with Properties added over time to see exactly which properties were added in each period.
Open Customers tab (use Download Summary CSV on that tab)
Properties added over time
Section titled “Properties added over time”What it measures: A detailed list of every property added to your account.
Data source: Same as Properties added per period (only properties with at least one job).
How it’s calculated: One row per property, sorted by creation date. Columns: date added, property ID, property name, address, city, state, postal code, contact name, email, phone, and number of completed jobs.
When to use it: Drill into who joined and follow up on new customers that have not yet built job history.
Open Customers tab (use Download Detailed CSV on that tab)
Financial tab
Section titled “Financial tab”Revenue estimates, materials spend, and billing totals.
Estimated value of completed jobs
Section titled “Estimated value of completed jobs”What it measures: Combined estimated value of work you have already completed.
Data source: Completed jobs, using each job’s estimated value in SortScape.
Default view: Last 7 days, line chart, grouped by day.
Filters: Date range, group by, property, job tag. Advanced: chart type.
When to use it: Historical revenue trend from operations data before invoicing. Compare with Value of invoices created to see gaps between work done and invoices raised.
Value of items used
Section titled “Value of items used”What it measures: Dollar value of items (or materials) recorded on completed jobs, at the price you charge the customer.
Data source: Item/material lines on completed jobs, grouped by item type.
How it’s calculated: Sale price × quantity for each line. Every line item on the job counts, whatever the item is: products, and any services or labour items you add from your items catalogue (including ones synced from Xero or QuickBooks). Hours recorded under Time spent are not included. The Cost set on an item is not used.
Default view: Last 7 days, horizontal bar chart.
Filters: Date range, group by, item/material type, property, job tag. Advanced: chart type.
When to use it: How much you invoiced for each item, and which items earn the most. To see one item on its own (for example a labour or service item), pick it in the item/material type filter. See also Quantity of items used and Detail of items used on the Materials tab.
Future-looking tab
Section titled “Future-looking tab”Scheduled workload and forward revenue.
Number of jobs scheduled
Section titled “Number of jobs scheduled”What it measures: Count of future jobs on the calendar.
Data source: Scheduled jobs that are not skipped.
Default view: Next 7 days, line chart, grouped by day.
Filters: Future date range, group by, job tag. Advanced: chart type, stacked on/off.
When to use it: Upcoming job count for planning crews, routes, and equipment. Pair with Future estimated hours for time load, not just job count.
Materials tab
Section titled “Materials tab”Item and material usage on completed jobs. Depending on your account settings, SortScape labels these Items or Materials.
Value of items used
Section titled “Value of items used”See Value of items used under the Financial tab.
Quantity of items used
Section titled “Quantity of items used”What it measures: How many units of each item/material were used on completed jobs.
Data source: Item/material quantity lines on completed jobs.
Default view: Last 7 days, horizontal bar chart.
Filters: Date range, group by, item/material type, property, job tag. Advanced: chart type.
When to use it: Volume trends (litres, bags, hours of hire equipment, and so on) rather than dollar cost.
Detail of items used
Section titled “Detail of items used”What it measures: Every item/material line on completed jobs in the period.
Data source: Individual item rows on completed jobs.
How it’s calculated: Table report (no chart). Columns: item/material name, quantity, price, job date, property, and notes. Price is the unit sale price on the line, not the item’s cost.
Default view: Last 7 days, table.
Filters: Date range, item/material type, property. Advanced: job tag.
When to use it: Audit usage, reconcile stock, or export specific lines for analysis in a spreadsheet.
Timesheets tab
Section titled “Timesheets tab”Total timesheet hours by employee
Section titled “Total timesheet hours by employee”What it measures: Hours recorded on employee timesheets.
Data source: Timesheet entries (not job hours).
Default view: Last 7 days, stacked column chart, grouped by day.
Filters: Date range, group by, employees. Advanced: approval status (pending / approved / rejected), chart type, stacked on/off.
When to use it: Payroll and attendance review. This is clocked shift time on timesheets, not hours added to jobs. For hours logged on jobs, use Total hours by employee (totals) or Detail of hours on jobs (one row per time block).
Requirements: Timesheets must be enabled for your account.
Quote reports
Section titled “Quote reports”Open the Quotes tab in Reports for conversion and pipeline insights. Conversion rate reports also appear on the Home tab. Go directly to Quote reports.
Quote reports default to the last 3 months, grouped by month. Use Date basis to filter by quote date or sent date, and change the chart type or date range from the report filters.
In quote reports, sent quotes means any quote with a sent date, regardless of its current status (accepted, scheduled, declined, or still awaiting a response). The conversion rate charts break those sent quotes down further. Not responded is the share still in Sent status (sent to the customer but not yet accepted, scheduled, or declined).
Quote conversion rate (count)
Section titled “Quote conversion rate (count)”What it measures: Share of sent quotes by outcome in each time period.
Data source: Quotes with a sent date.
How it’s calculated: For each day, week, month, or year, stacked columns show Converted (accepted or scheduled), Not responded (still sent), Declined, and Draft. Each column totals 100%.
Quotes stay in the period when they were sent (or quoted), using Date basis: quote date (default) or sent date, even if accepted or scheduled later.
Default view: Last 3 months, stacked column chart, grouped by month.
Filters: Date range, date basis, group by. Advanced: chart type (pie chart shows the whole-range mix).
When to use it: Sales effectiveness over time. The detail column lists individual quotes when you expand a segment.
Quote conversion rate (value)
Section titled “Quote conversion rate (value)”What it measures: Same breakdown as the count report, but uses each quote’s total dollar value instead of counting each quote as 1.
When to use it: Whether you are winning high-value quotes or mostly smaller ones. Use alongside the count report: high count conversion with low value conversion can mean you win small jobs but lose large ones.
Sent and converted quotes
Section titled “Sent and converted quotes”What it measures: Quote volume over time as two separate series.
Data source: Sent counts quotes whose sent date falls in each period. Converted counts quotes accepted or scheduled in each period (using accepted date, or the first linked job date for scheduled quotes).
How it’s calculated: Grouped columns. The two series are not forced to add up to 100%.
Default view: Last 3 months, column chart, grouped by month.
Filters: Date range, date basis, group by. Advanced: chart type, stacked on/off.
When to use it: Whether you are sending more quotes and whether conversions are keeping pace. A rising sent line with a flat converted line may mean a follow-up problem.
Sent and converted quote value
Section titled “Sent and converted quote value”What it measures: Same as Sent and converted quotes, but uses quote totals instead of quote counts.
When to use it: Pipeline dollar trends rather than quote count trends.
Quote status overview
Section titled “Quote status overview”What it measures: Mix of quote outcomes in the selected date range.
Data source: Quotes filtered by quote date or sent date.
How it’s calculated: Pie chart. Converted combines accepted and scheduled quotes. Quotes still in Sent status appear as Not responded. The detail column shows each quote’s actual status (for example Accepted or Scheduled).
Default view: Last 3 months, pie chart.
Filters: Date range, date basis. Advanced: chart type.
When to use it: Snapshot of your quote pipeline for a period without the time-series view of the conversion rate charts.
Choosing the right report
Section titled “Choosing the right report”| Question | Start here |
|---|---|
| Report over months instead of the default preview? | Open the report → magnifying glass → change Date range (e.g. last 12 months) and Group by → Month. Not on Premium? See Not on Premium? above. |
| Track one person’s hours reducing over time? | Total hours by employee (filter to that employee, group by month). Without Premium, export completed jobs and total hours from the Note column. |
| Who worked the most hours on jobs? | Total hours by employee |
| Export every time block logged on jobs? | Detail of hours on jobs (raw rows, not timesheet hours) |
| Who clocked the most shift time? | Total timesheet hours by employee |
| Which customers use the most time? | Total hours per property |
| Which customers are most profitable per hour? | Estimated revenue per hour per property |
| Are we underestimating jobs? | Estimated vs actual hours or Hours over budget by property |
| What is scheduled revenue worth? | Estimated value of future jobs |
| What did we actually invoice? | Value of invoices created |
| What materials did we use? | Value, Quantity, or Detail of items used |
| How is quote follow-up going? | Quote conversion rate or Sent and converted quotes |
| Are we overbooking the team? | Total hours scheduled vs hours available (future date range) |
| How utilized was the team on completed work? | Total actual hours vs hours available (past date range) |
| Labour utilization % for one employee? | Total actual hours vs hours available, filter by employee |
| How fast are we adding customers? | Properties added per period |